Back of House
Your whole portfolio, at a glance, every morning.
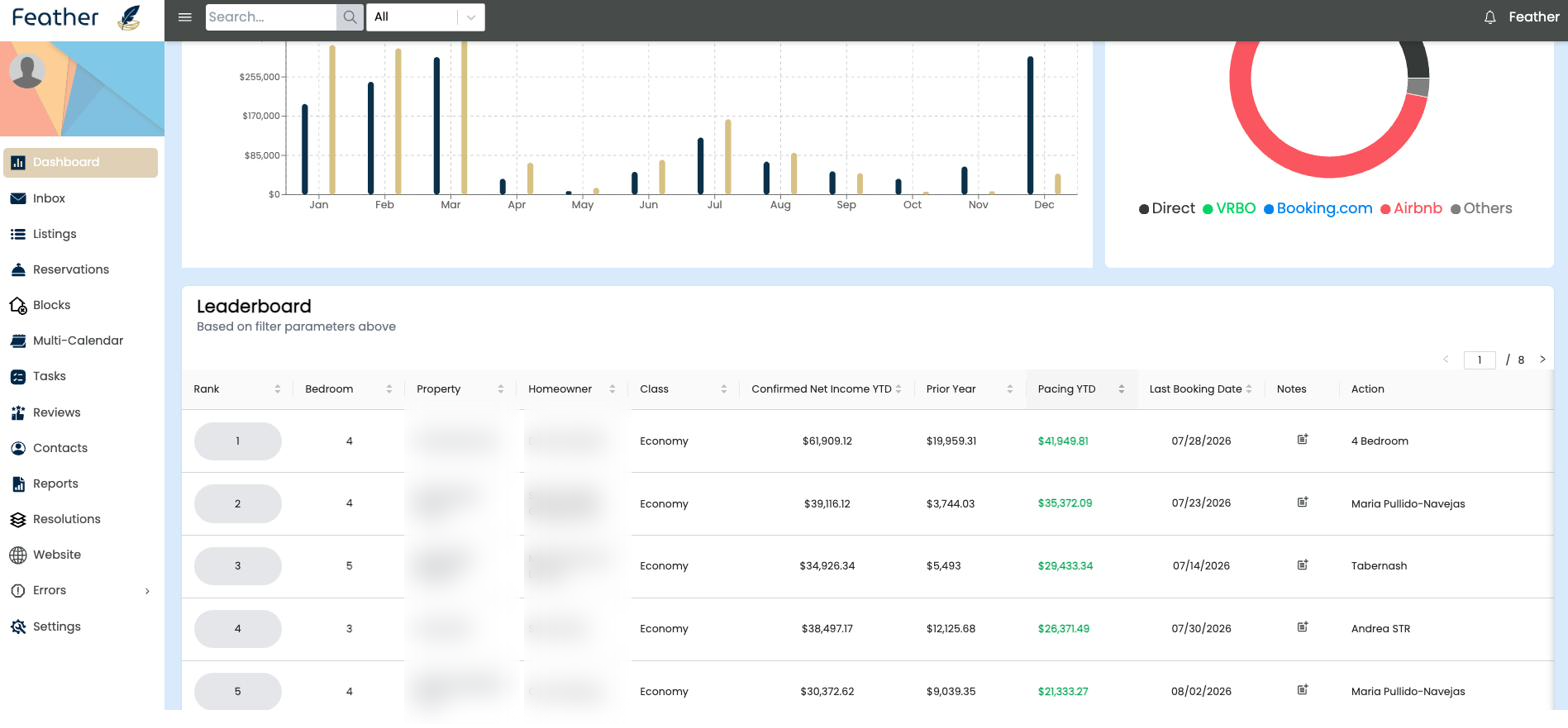
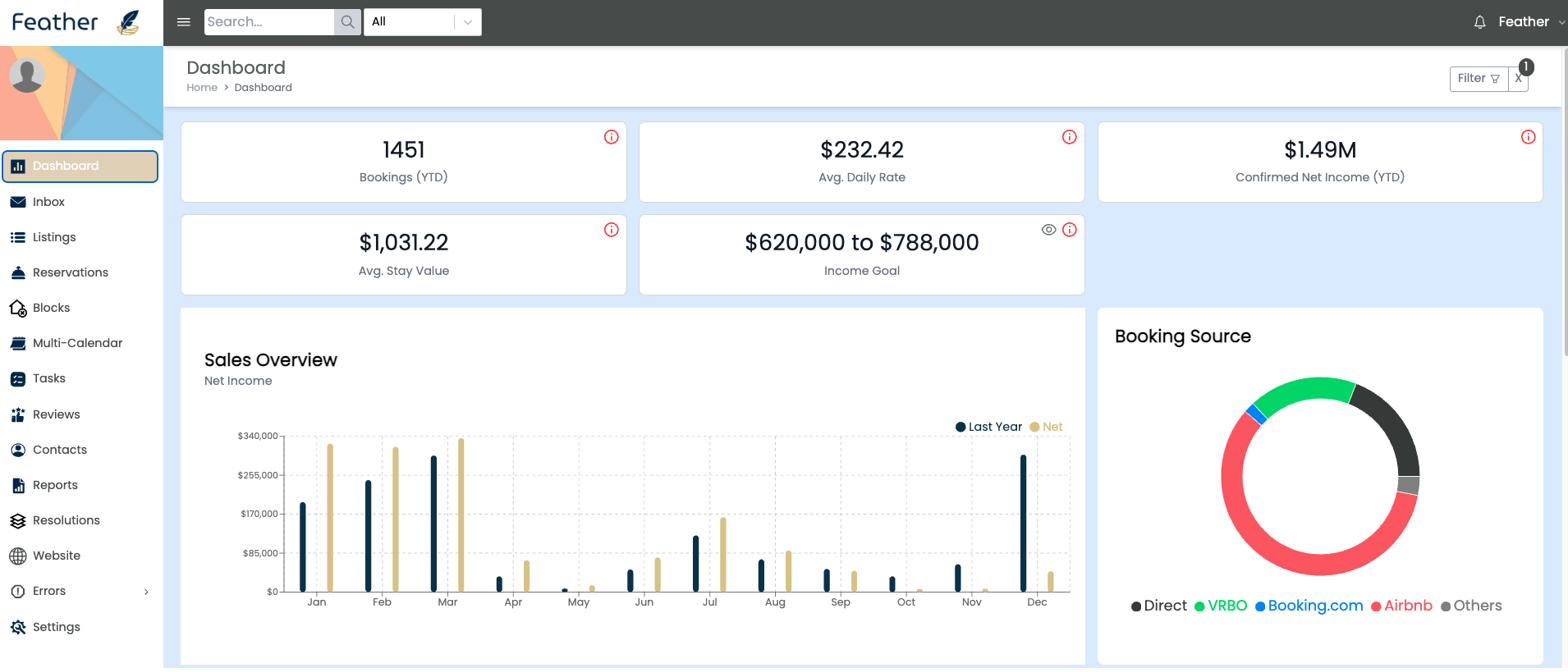
Bookings, average daily rate, net income, stay value, income-goal pacing and booking-source mix — the numbers that run your business, live on one screen.
Book a Demo
The metrics that matter, up top
Bookings YTD, average daily rate, confirmed net income, average stay value and your income-goal range sit front and center — so you know where you stand before your first coffee.
See where your business actually comes from
The booking-source breakdown shows how much of your revenue is Direct vs. Airbnb, VRBO and Booking.com — the single most important chart for anyone trying to grow direct and cut channel dependence.
Pace against last year
The sales overview plots this year's net income against last year's, month by month, so you can see momentum — or catch a soft month early enough to do something about it.